Analytics Deep Dive
The Analytics section gives you detailed insights into your zap activity and engagement patterns.
Understand what works, optimize your strategy, and grow your earnings.
Time-Based Views
Switch between different time periods:
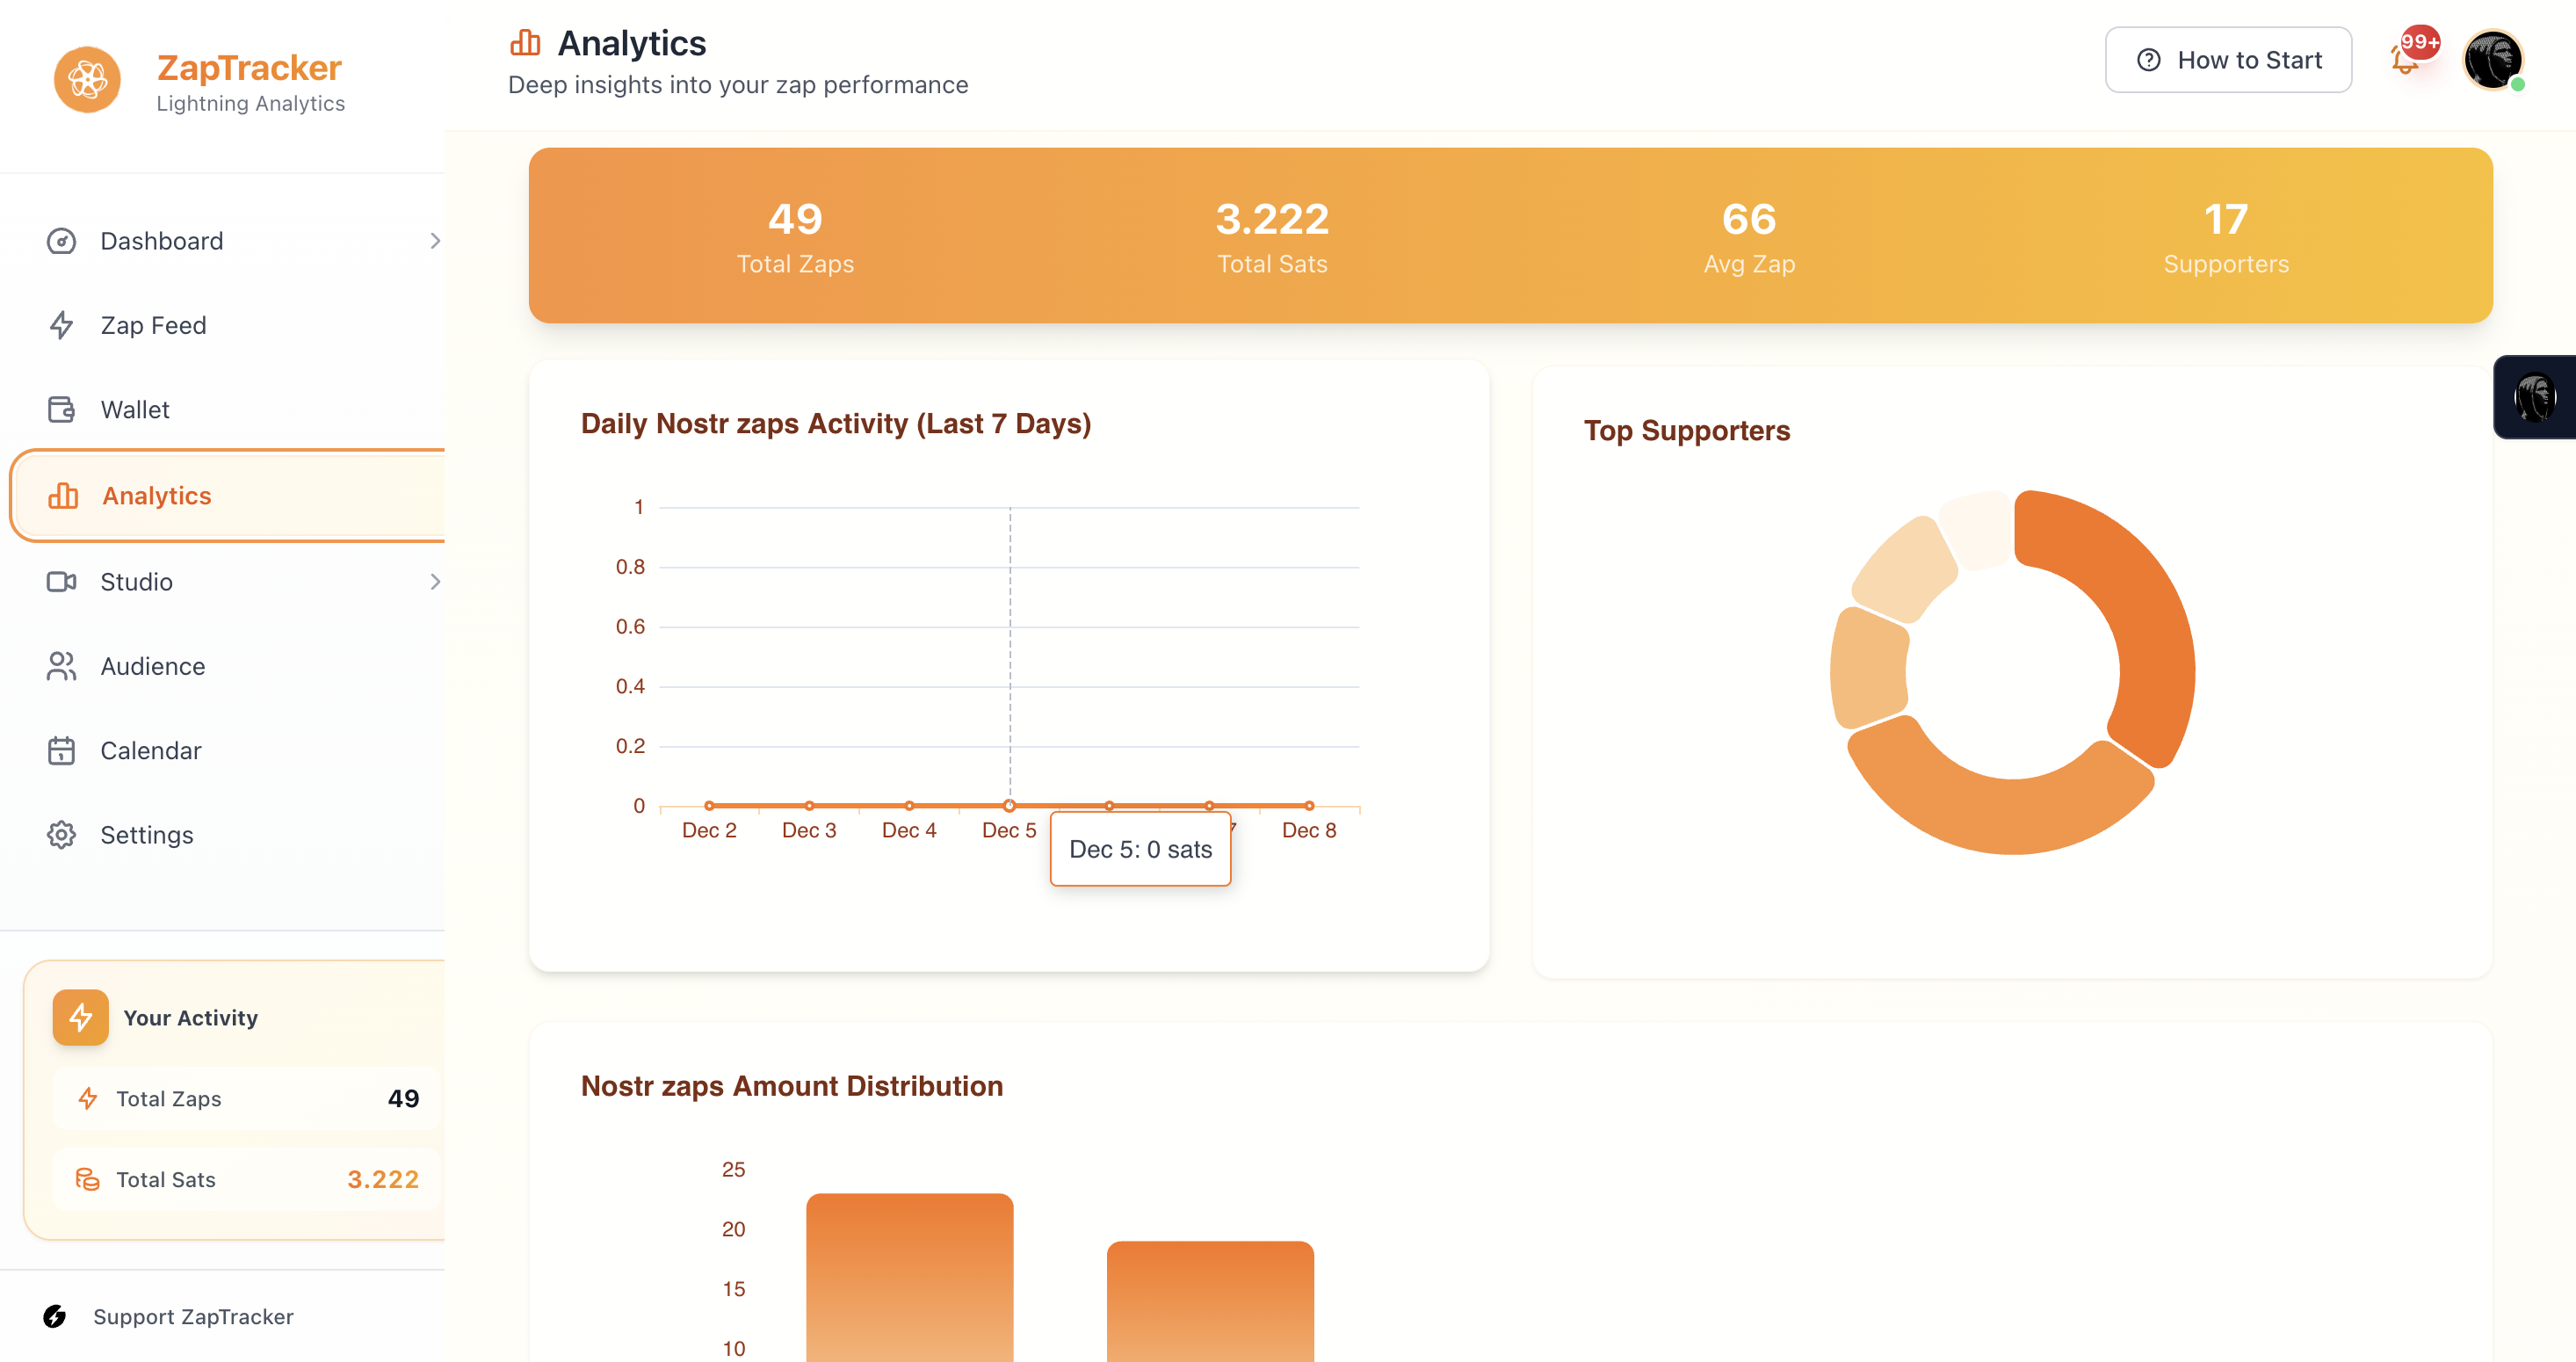
Daily View
Granular day-by-day breakdown. Best for tracking recent activity and hourly patterns.
Weekly View
Week-over-week comparison. Identify weekly trends and consistent patterns.
Monthly View
Long-term perspective. Track growth over time and seasonal trends.
Key Metrics
Zap Volume
Total zaps received over the selected period:
- Compare periods to track growth
- Correlate with content or campaigns
- Identify your best-performing times
Sats Earned
Total satoshis received:
- Track your earnings
- Calculate averages
- Project future earnings
Average Zap Size
Mean amount per zap:
- Higher = more meaningful engagement
- Lower = more casual, frequent zaps
- Changes can indicate audience shifts
Unique Zappers
Individual people who zapped you:
- Your engaged community size
- New vs returning supporters
- Community growth rate
Engagement Metrics
Top Supporters
Your most generous zappers:
- Who supports you most
- Total sats from each person
- Frequency of their zaps
Use this to:
- Thank your biggest supporters
- Understand who values your work
- Build deeper relationships
Zap Distribution
How your zaps break down by size:
| Range | Meaning |
|---|---|
| 1-100 sats | Casual appreciation |
| 100-1000 sats | Meaningful support |
| 1000-10000 sats | Strong endorsement |
| 10000+ sats | Major contribution |
This shows your audience's engagement style.
Peak Times
When your audience is most active:
- Best times to post
- When to launch campaigns
- Optimal engagement windows
Content Performance
Per-Content Analytics
See which content earns the most:
- Sort by zaps received
- Sort by sats earned
- Identify top performers
Content Types
Compare performance by type:
- Short notes vs long-form
- Topics and themes
- Format experiments
Using Analytics to Improve
Identify What Works
- Find your top-performing content
- Analyze what made it successful
- Create more like it
Questions to ask:
- What topic was it?
- What format worked?
- When did you post it?
- How did you promote it?
Find Optimal Timing
- Check your peak times
- Schedule content for those windows
- Test different times
- Refine your schedule
Recognize Patterns
Look for correlations:
- Content type → engagement level
- Posting time → reach
- Promotion effort → results
Track Campaign ROI
For ZapGoals:
- Compare goal vs actual
- Analyze contributor patterns
- Learn for future campaigns
Exporting Data
You can export your analytics for:
- Personal records
- Tax purposes
- External analysis
Tips for Analytics
Regular Review
Daily for feedback, weekly for trends, monthly for strategy
Dont Overreact
Single data points can be noise. Look for patterns over time
Focus on Growth
Compare to your own past performance. Set realistic goals
Connect to Actions
More of what works, less of what doesnt. Experiment