Understanding Your Dashboard
The Dashboard is your command center in ZapTracker.
Get a real-time overview of your Lightning activity and Nostr engagement at a glance.
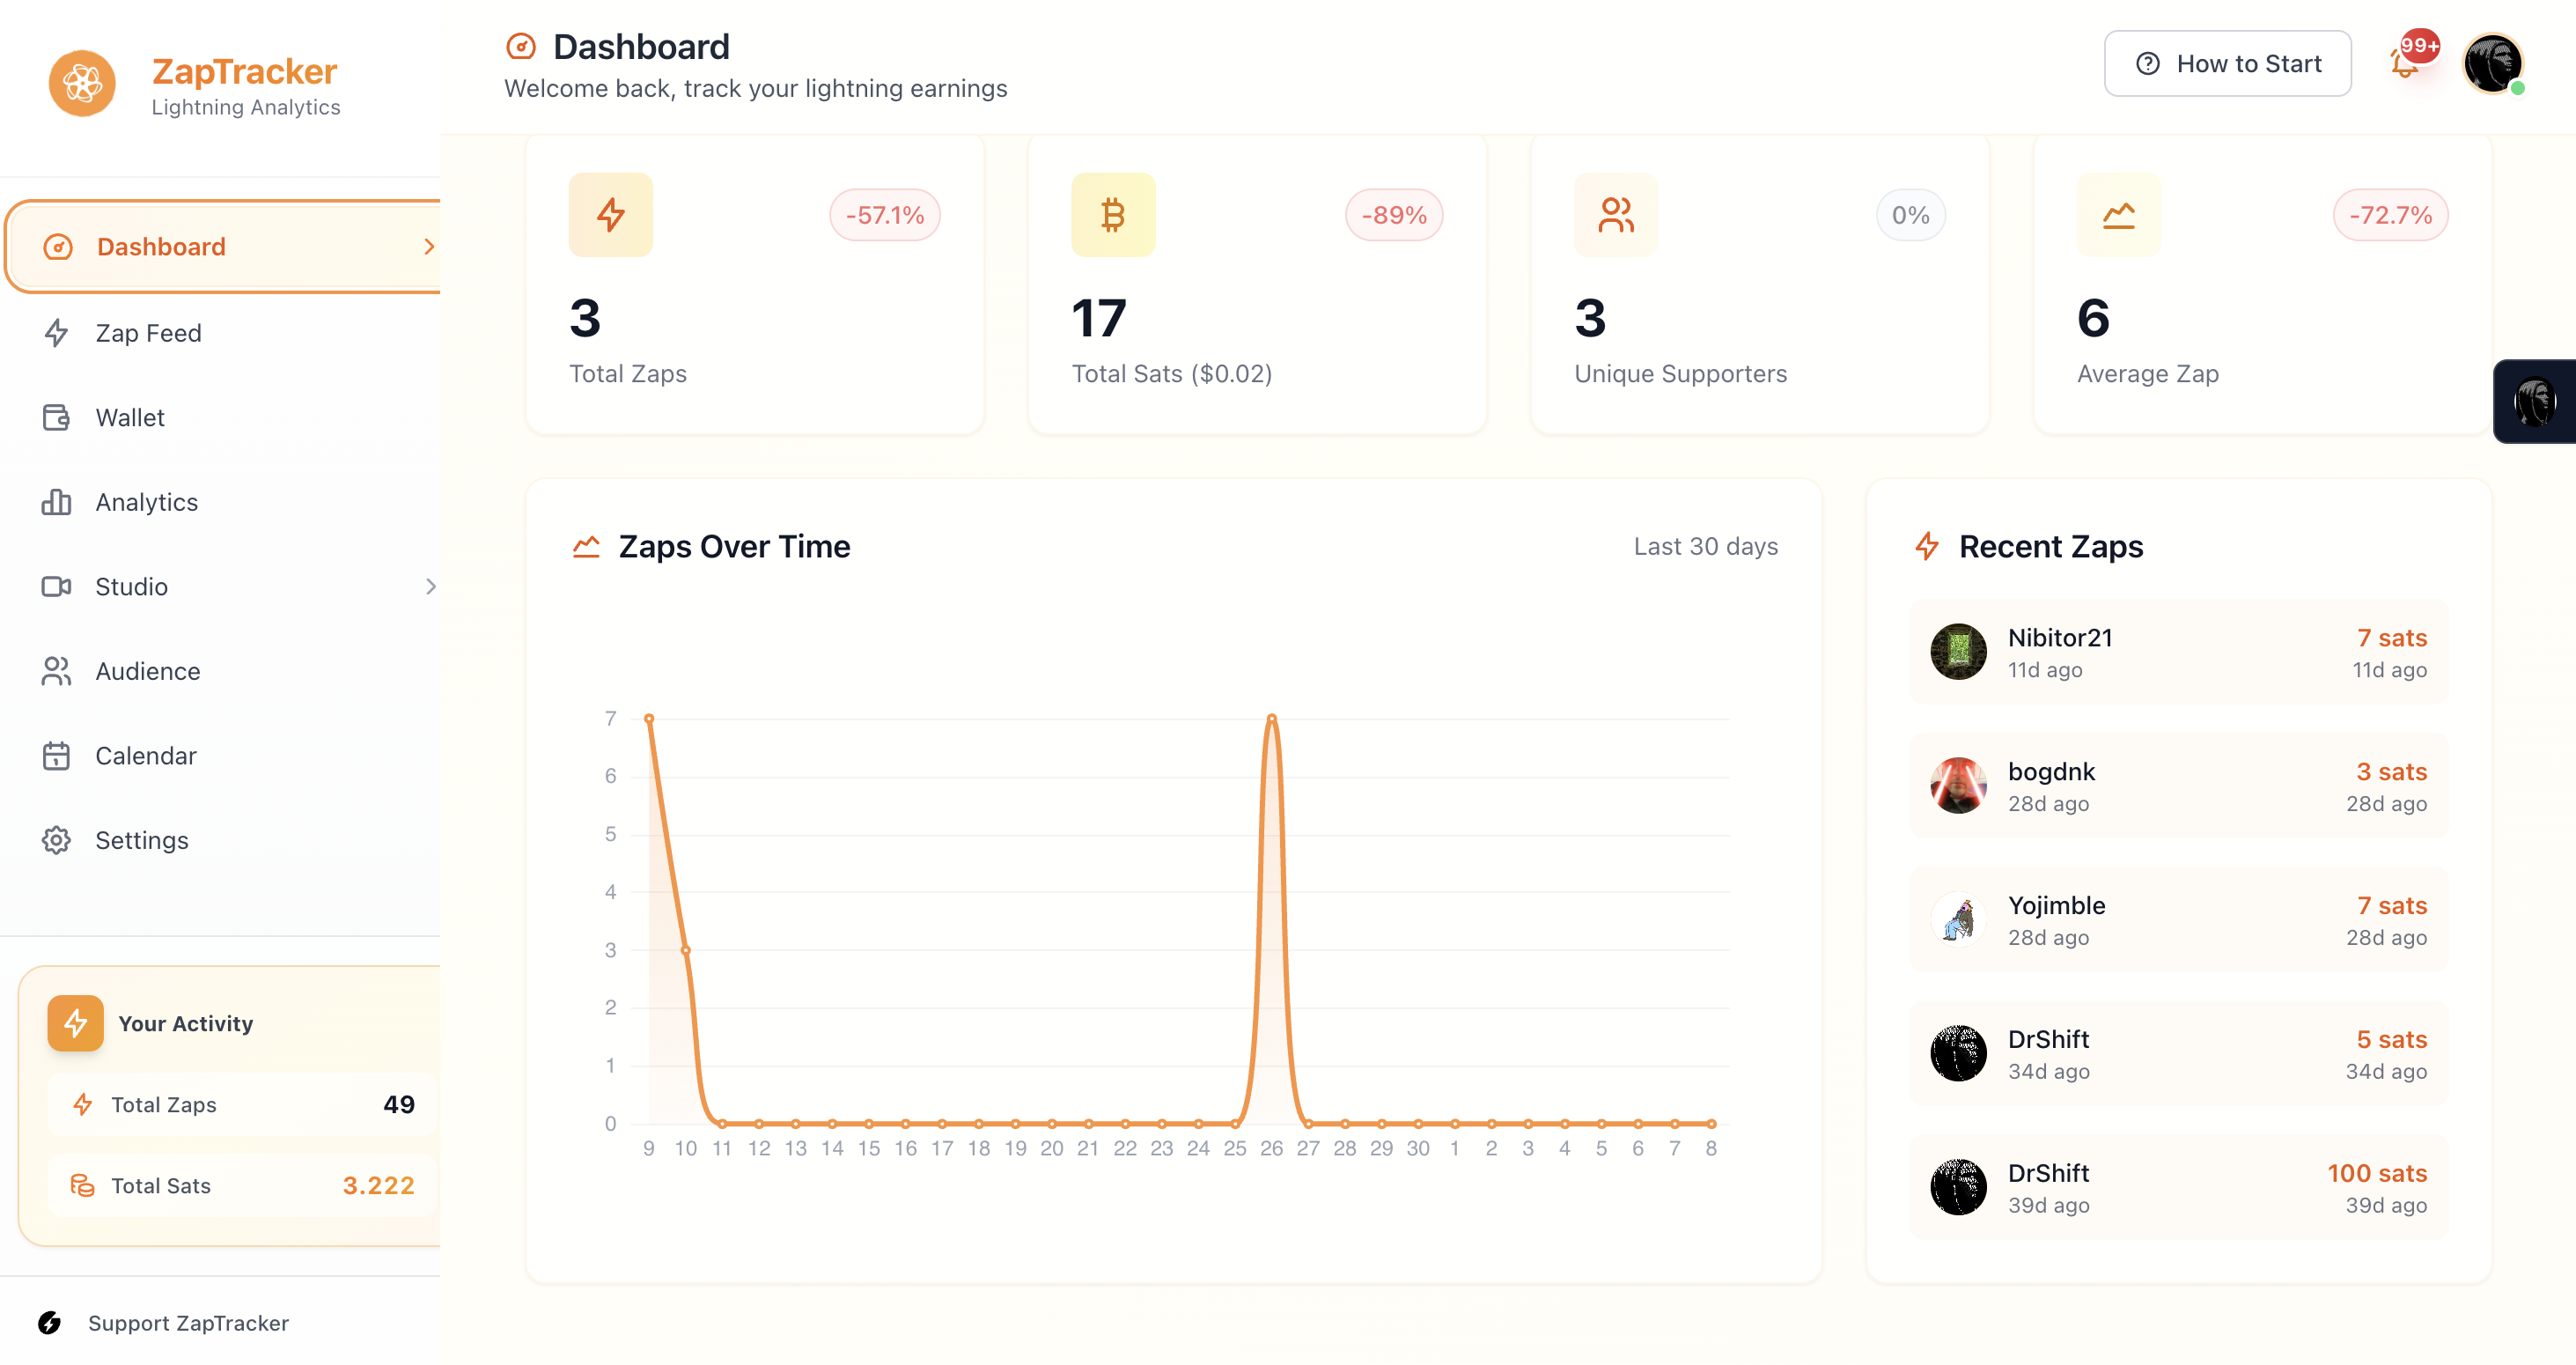
Key Metrics
Total Zaps
The number of zaps you've received. Each zap represents someone sending you sats as appreciation for your content or work.
Total Sats
The cumulative amount of satoshis from all your zaps. This is your total earnings through zaps.
What's a Satoshi?
A satoshi (sat) is the smallest unit of Bitcoin. 100,000,000 sats = 1 Bitcoin.
Average Zap
The mean amount per zap. This metric helps you understand engagement quality:
- Higher average = Fewer, more meaningful zaps
- Lower average = More casual, frequent zaps
Both patterns are valid—it depends on your audience and content type.
Unique Supporters
The number of individual people who've zapped you. This shows your community size, distinct from total zap count.
Wallet Balance
Your current Lightning wallet balance (requires NWC connection). This updates in real-time as you send and receive payments.
The Activity Chart
The 30-day activity chart visualizes your zap patterns over time.
Reading the Chart
- Spikes often indicate viral content or successful campaigns
- Consistent levels show steady community engagement
- Dips might signal time for fresh content
Using the Chart
Look for patterns:
- What days are most active?
- Do certain content types perform better?
- Are there seasonal trends?
Zap Feed
Below your metrics, the Zap Feed shows incoming zaps in real-time:
- Sender's profile
- Amount sent
- Associated content (if any)
- Timestamp
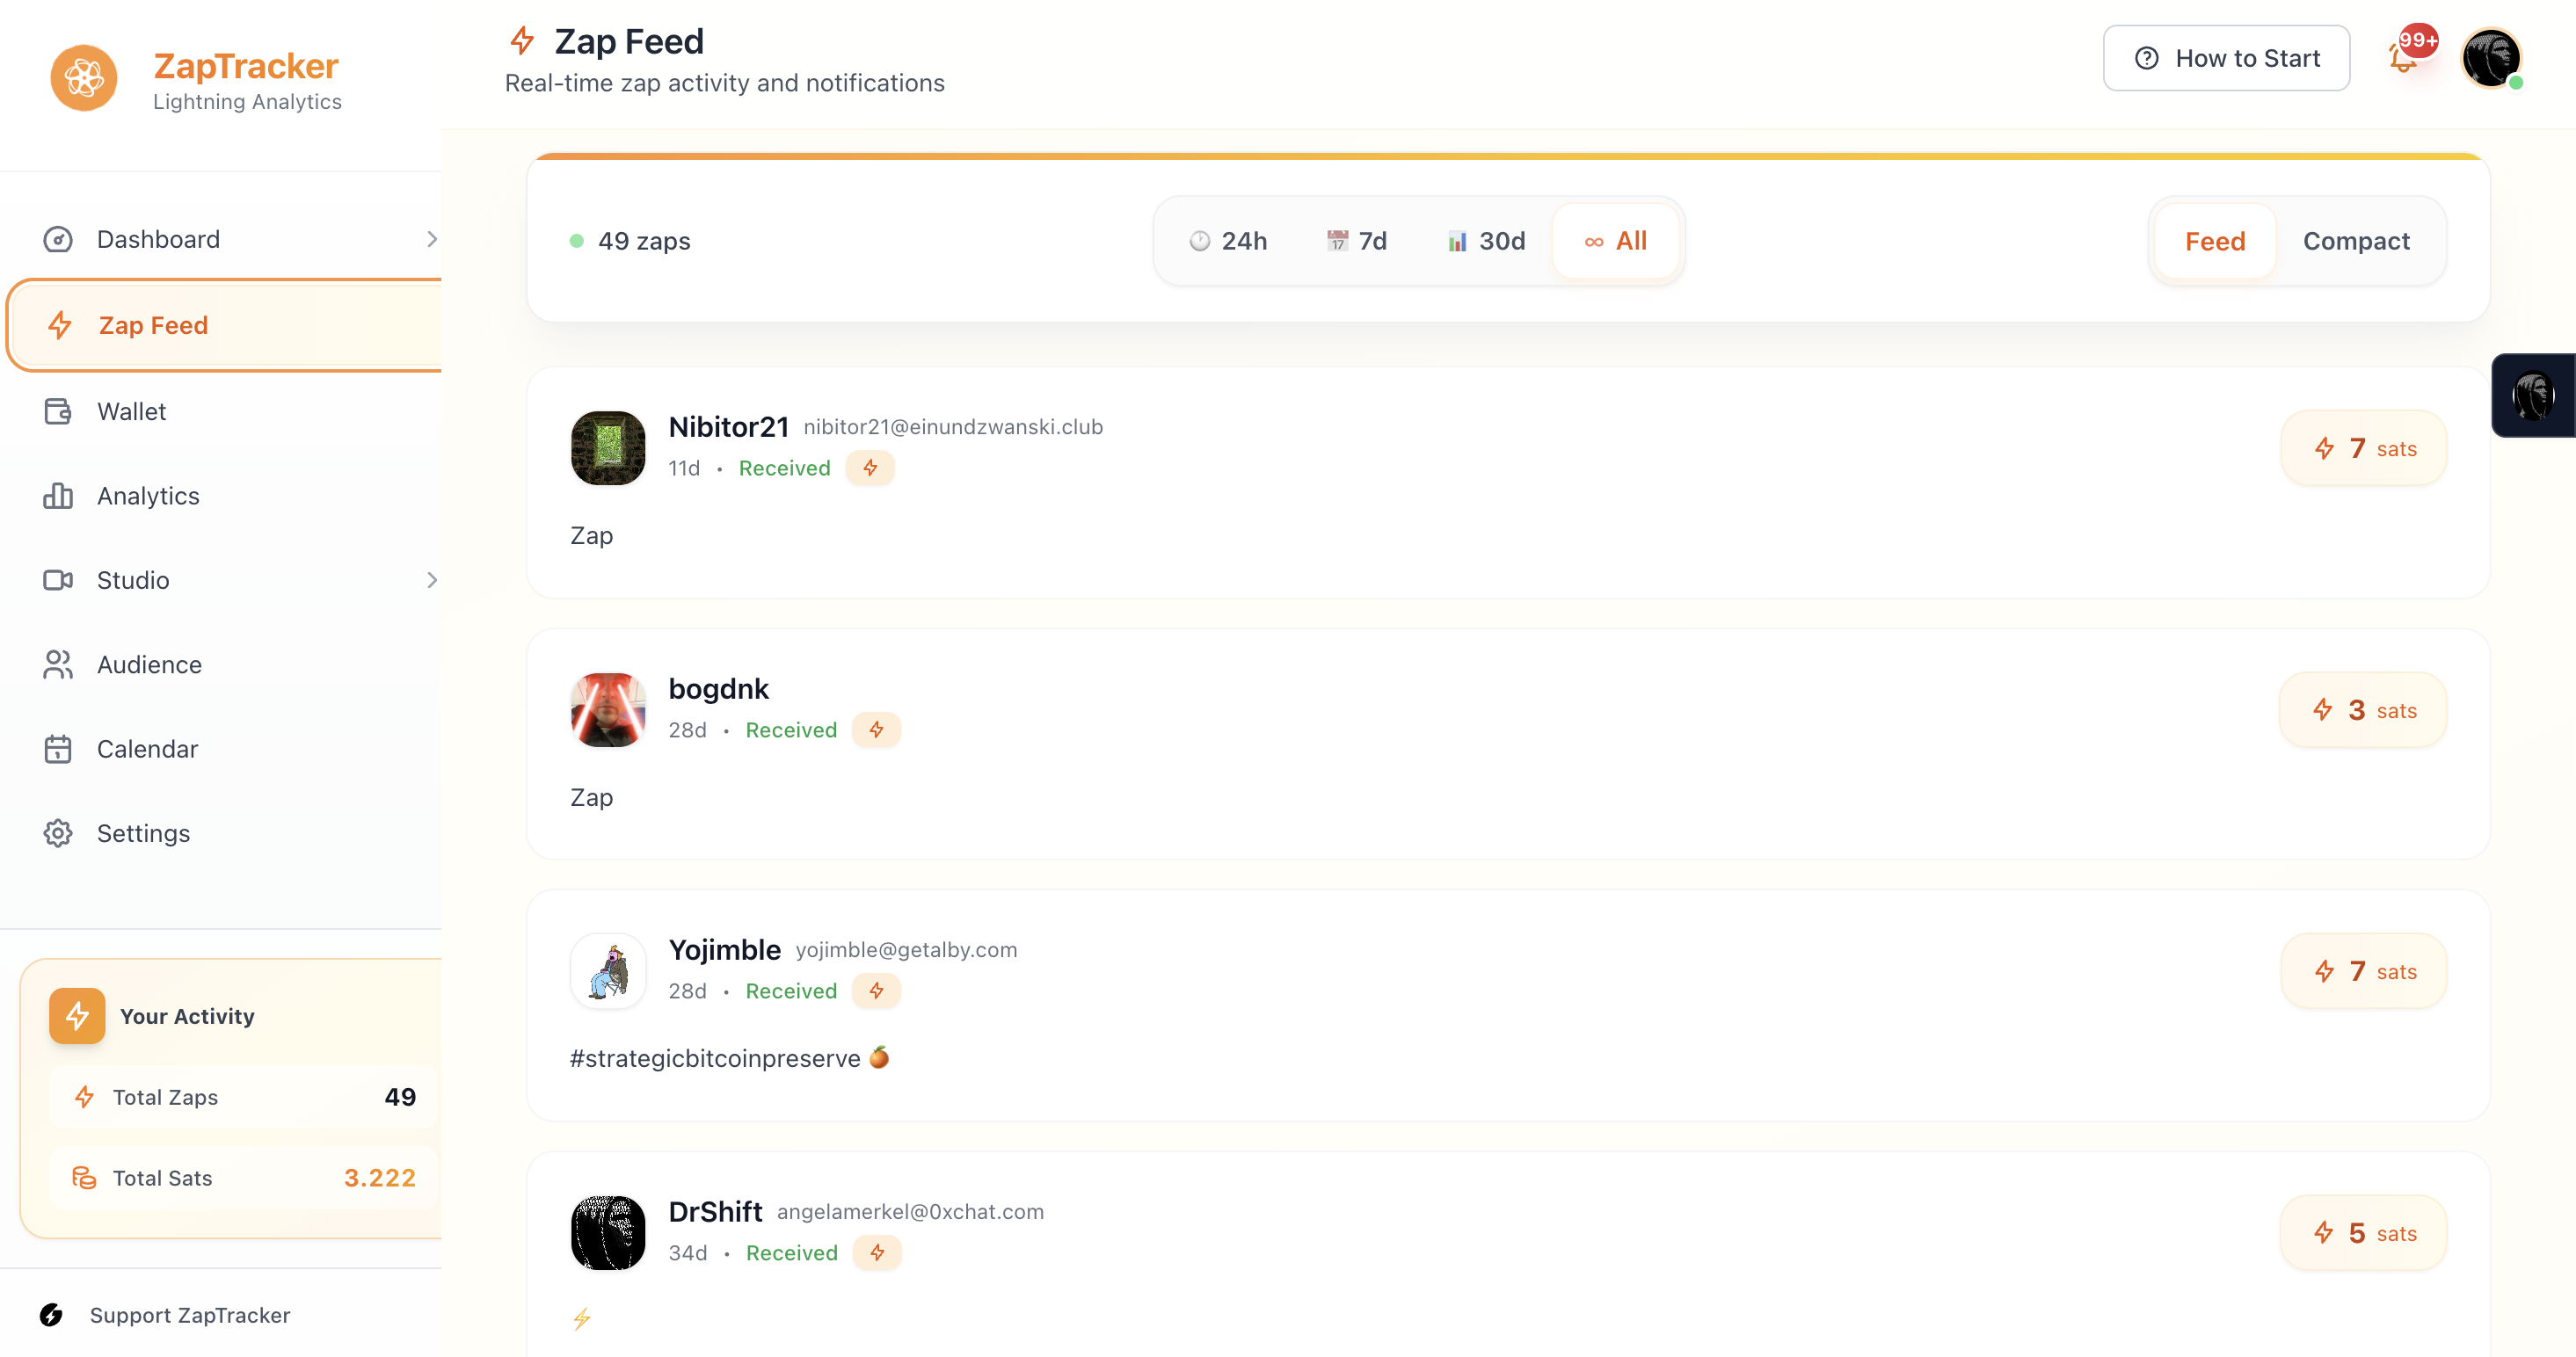
Click on any zap to see more details or view the sender's profile.
Quick Actions
From the dashboard, you can:
- Navigate to any section via the sidebar
- Click metrics to see detailed analytics
- Access recent zaps quickly
Tips for Your Dashboard
Check daily
Spot trends early
Note spikes
What caused them? Replicate success
Watch averages
Quality vs quantity of engagement
Track supporters
Your community is growing